
You click submit on a contact form. Nothing happens. You sit there wondering if it registered, whether to click again and risk sending it twice. Then the page might come to life, or it might not. That gap between your action and any visible response from the page is what INP measures. INP stands for Interaction to Next Paint, and it is one of Google's Core Web Vitals: the metrics Google uses to assess whether a page actually feels good to use. Not just on your first click, but on every click, tap and keystroke throughout a session.
In March 2024, Google replaced a metric called FID (First Input Delay) with a new one: INP, or Interaction to Next Paint. FID only captured how quickly a page responded to the very first interaction. INP measures all of them, throughout the full session. It is a more honest picture of how a page actually feels to use. And it turns out that many sites which passed FID comfortably are failing INP badly.
Two years on, 28% of websites are failing it.1
Why INP Is the Hardest Core Web Vitals Metric to Fix
The other two Core Web Vitals are relatively well understood now. LCP (Largest Contentful Paint) is a loading problem: the page takes too long to show its main content. Fix it with faster servers, optimised images and less render-blocking code. CLS (Cumulative Layout Shift) is a layout problem: elements jump around as the page loads. Fix it with stable structure and explicit dimensions. Both pass on over 78% of websites.2
LCP
Largest Contentful Paint
How long it takes for the main visible content to load on screen.
Good threshold
Under 2.5s
Current pass rate
78%+ of sites pass
How to fix
Loading performance
Faster servers, optimised images, less render-blocking code.
CLS
Cumulative Layout Shift
How much elements jump around as the page loads.
Good threshold
Under 0.1
Current pass rate
78%+ of sites pass
How to fix
Layout stability
Stable structure and explicit dimensions on images and embeds.
INP
Interaction to Next Paint
How fast the page responds to every click, tap and keystroke throughout a session.
Good threshold
Under 200ms
Current pass rate
28% of sites failing
How to fix
JavaScript architecture
Main thread work must be restructured. Cannot be fixed with CDN or hosting upgrades.
INP is different. Under 200ms is Good, 200-500ms is Needs Improvement, over 500ms is Poor. The problem is almost always JavaScript executing too much work on the main thread at the wrong moment. When a user clicks and the browser is already processing something else, parsing a script, handling a state update, running an animation, the response is blocked. The user waits.
You cannot fix this with a CDN or a hosting upgrade. It requires profiling what the JavaScript is doing during user interactions, identifying which event handlers are blocking the main thread, and restructuring how the code responds to input. That is architecture work.
And architecture is often where the real problem sits. It is rarely one piece of bad code. More often it is the accumulated weight of how the site was originally built: a WordPress installation with 40 or 50 plugins because whoever put it together reached for a plugin every time a new feature was needed, rather than building it properly; a page builder like Elementor, Divi or Wix that outputs layers of JavaScript and CSS the site never needed; or an old platform running on shared hosting that was never designed for the interaction patterns of a modern web page. The site might look fine. Under every click, the browser is working through a tangle it was never set up to untangle quickly.
This matters because patching the surface rarely moves INP in any meaningful way. The metric forces a conversation about the foundations. That is often the right conversation to be having anyway, because a site built on weak architecture is not just slow to interact with. It is slow to improve, slow to extend, and increasingly disadvantaged as the standards for what constitutes a good web experience keep rising.
What It Looks Like Across UK Brands
The numbers tell part of the story. The real-world experience tells the rest.
Think about doing your weekly grocery shop on Iceland. You are clicking through categories, adding items, changing quantities. Each click waits. Not long enough to be obviously broken, just long enough to feel like the site is thinking. Now compare that to browsing the IKEA site for a living room piece: you filter, you click, you move between items. The page responds before you have finished thinking. That difference is INP, and it plays out across every interaction in a session.
According to Fasterize's monthly UK web performance rankings, which draw on real CrUX field data from actual users, Iceland's mobile INP sits at 877-939ms.3 The Good threshold is 200ms. They are failing by nearly five times. Their LCP sits at 5,200-5,600ms against a Good threshold of 2.5 seconds. Their CLS is 1.0. All three Core Web Vitals failing simultaneously.
The same data puts Boots at 538ms and Next at 545-593ms, a figure that has been creeping upward month by month through 2025.3 These are household brands with technology budgets that most businesses would not recognise. Poor INP is not a resource problem. It is an architecture problem, and it does not discriminate by company size.
IKEA's mobile INP on the same dataset is 155ms. The difference between what a customer experiences on the IKEA site and the Iceland site is hundreds of milliseconds on every single click, recorded from real UK users on real devices.3
On the public sector side, gov.uk consistently passes all three Core Web Vitals and is one of the better-performing large-scale sites in the country. The Government Digital Service has published extensively on performance as a design principle, and it shows in the numbers. A government site is not an obvious benchmark for a retailer, but the point stands: performance at scale is achievable when it is treated as a requirement rather than an afterthought.
INP performance: UK brands compared
Real field data from UK mobile users. Bars are colour-coded by zone: green (Good), amber (Needs Improvement), red (Poor).
Source: Fasterize monthly UK web performance rankings (CrUX field data)
Feel the Difference
Numbers are one thing. The interactive demo below lets you feel the delays in real time. Click each brand's button and wait for the confirmation. The tick appears after the actual INP delay measured from real UK users on that site.
Feel the difference
Click each button. The confirmation appears after the real INP delay for that site, based on CrUX field data from real UK users.
IKEA
Good · 155msBoots
Poor · 538msNext
Poor · 570msIceland
Poor · 920msCumulative wait across 100 interactions in a session
IKEA
15.5s
total wait
Boots
53.8s
total wait
Next
57.0s
total wait
Iceland
92.0s
total wait
An Iceland customer waits nearly 60 times longer per session than one on IKEA, for the same number of interactions. That is not a performance gap. It is a customer experience gap.
Why This Is a Paid Media Problem, Not Just an SEO One
Google has used Core Web Vitals as a ranking signal since 2021, and sites passing all three see 24% lower bounce rates.4 There is also emerging evidence in 2026 that page performance influences whether a site gets cited in Google's AI Overviews, which matters more than ever as AI-generated answers capture an increasing share of clicks. If that is new territory, the previous article on what AI search tools are actually using to select citations covers the full picture.
The paid media angle gets less attention, but it hits the budget more directly.
When someone clicks a Google or Meta ad and lands on a page with a 900ms INP, their next interaction, clicking a product, opening a menu, adding to a basket, is slow. Google Ads measures landing page experience and factors it into Quality Score. A poor landing page experience inflates cost-per-click and reduces Ad Rank. You are paying more per click to deliver a worse outcome, and your account's aggregate Quality Score reflects that across every campaign over time.
The compounding effect is significant. Poor INP means wasted spend on clicks that land somewhere substandard, and a quality signal that makes the next click more expensive. It is one of the most consistent and least-discussed reasons paid media performance plateaus despite increasing budgets.
How poor INP compounds in paid media
A slow landing page does not just affect user experience. It triggers a cascade through Quality Score that makes every pound of ad spend less effective.
INP over 500ms
Every visitor interaction feels sluggish. Clicks, basket updates and form submissions all lag.
Poor landing experience
Google Ads measures what visitors do after clicking your ad. Slow pages lose them fast.
Quality Score drops
Google penalises low-quality landing pages. Your bids become less competitive in the auction.
Cost-per-click rises
A lower Quality Score means paying more for the same ad position, on every single click.
Budget compounds the problem
More spend buys fewer impressions, reaching fewer people, delivering a worse experience on arrival.
What Fixing It Actually Requires, and Why It Is Worth It
This is where it becomes a business decision rather than a technical one.
A site that is failing INP because of plugin overload or a bloated page builder is not going to be fixed by tweaking settings. The underlying problem is that the site was built in a way that prioritises convenience at the point of construction over performance at the point of use. Every visitor who clicks, waits and leaves is an ongoing cost that does not appear in any invoice but shows up in conversion rates.
The realistic options are either a proper development audit that strips out what should not be there and restructures what remains, or a rebuild on foundations that treat performance as a requirement from the start. Neither is glamorous. Both are investments. But compared to the ongoing cost of running paid media into a slow site, or losing organic visibility because the technical signals are working against you, getting it right is almost always the more profitable path.
The sites we build at FSM are audited against Core Web Vitals at the architecture level. INP is a first-class concern from the moment the project starts, not something added afterwards. You can see what that looks like across our case studies, and the budgets involved vary far more than people assume. Getting the foundations right is not reserved for large brands. It is available to any business prepared to have the right conversation about what a website is actually supposed to do.
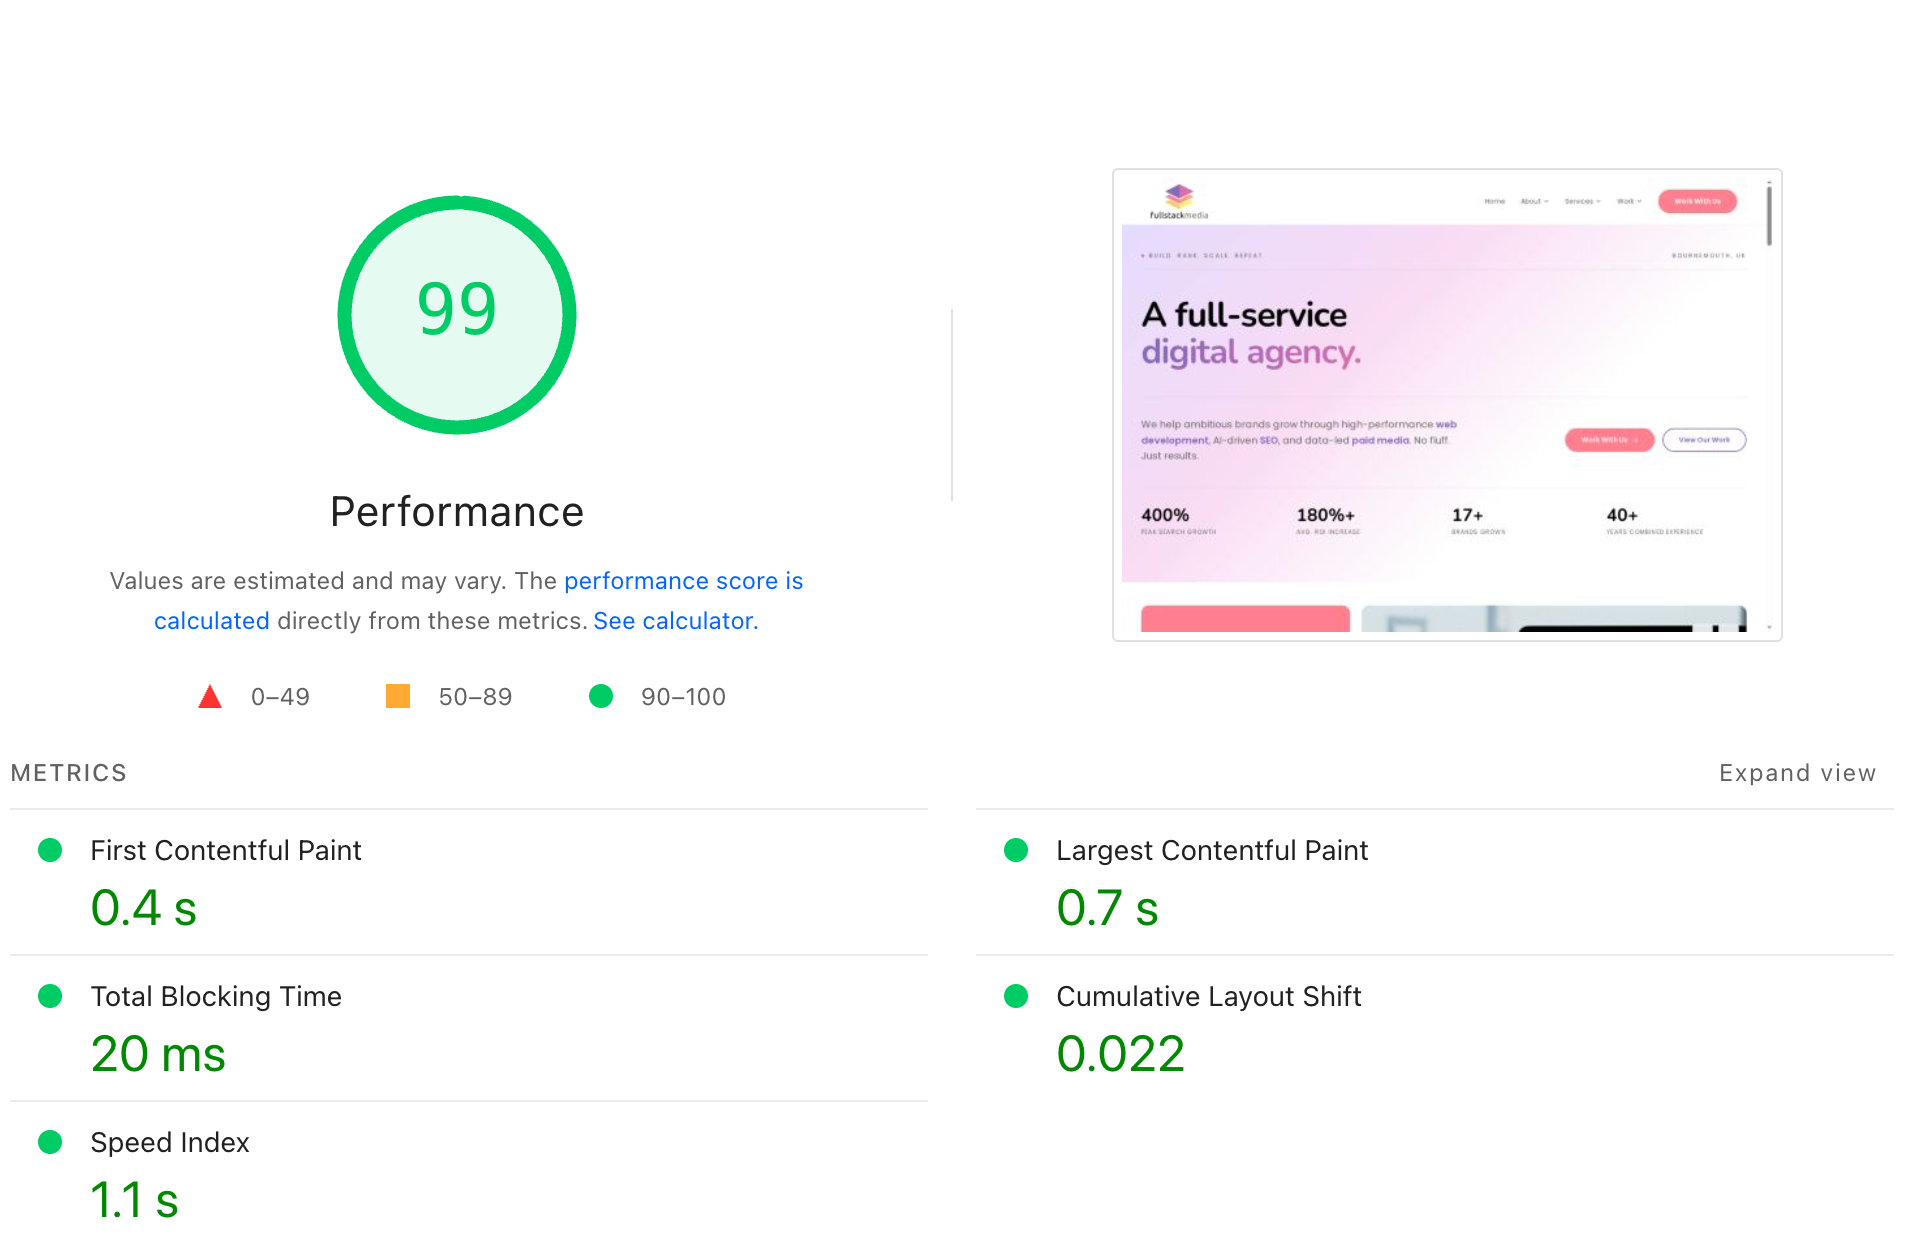
Full Stack Media's own site: 99 Performance score, FCP 0.4s, LCP 0.7s, CLS 0.022. Lab scores from PageSpeed Insights — built on the same foundations we deliver for clients.
Poor INP is invisible until you measure it. Your users are not complaining about it. They are just not coming back.
References